...
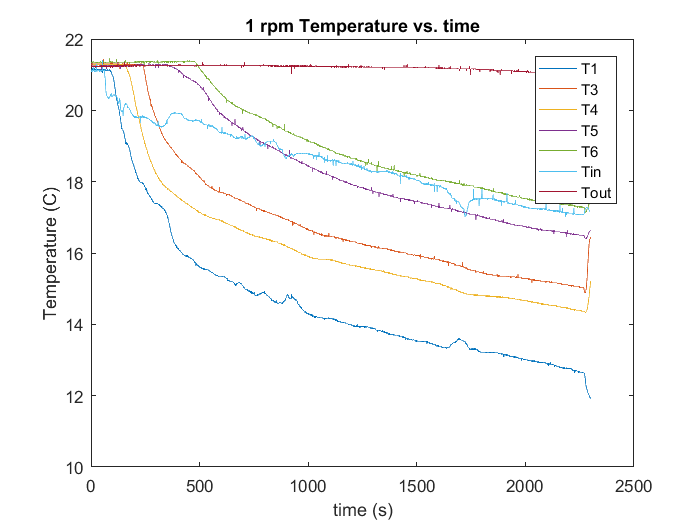
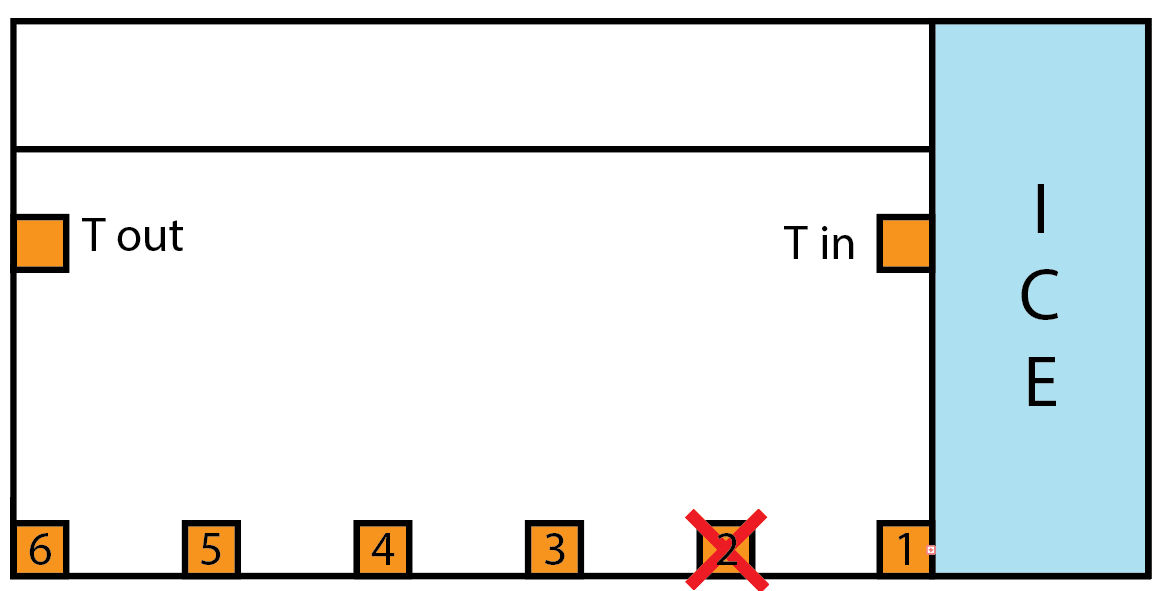
The temperature data from the thermometers revealed that an overall trend of decreasing temperature in the tank, as a result of the melting of the ice. The sensors at the bottom of the tank maintained a near-constant radial temperature over time, of about 4ºC. The temperatures higher up in the tank evolved differently however. The sensor on the edge of the tank measured a high temperature of about 21.2 ºC throughout the experiment, and the one on the ice bucket, gave a reading higher than all but the furthest sensor from the ice bucket at the bottom. These high temperatures are a result of the overturning circulation seen in the non-rotating case as well. Cold water near the ice bucket sinks and spreads along the bottom, leaving the surface water much warmer than that below.
Discretizing the equation for thermal wind and solving for u gives
...
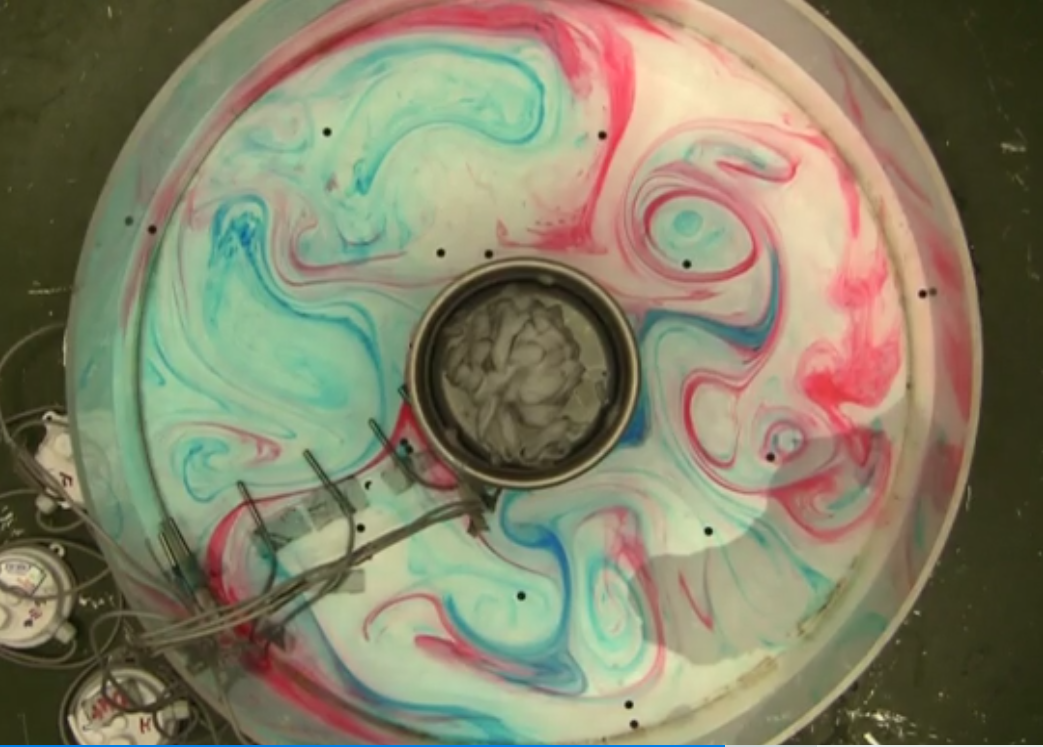
Red dye dropped near the edges and blue dye dropped near the ice bucket eventually swirled together, creating the beautiful image below. The dye helps illustrate the transport of heat through the bucket. Warm water from the outside is moved radially inwards and cold water at the center is moved radially outwards, in non-axisymmetric vortices around the tank.


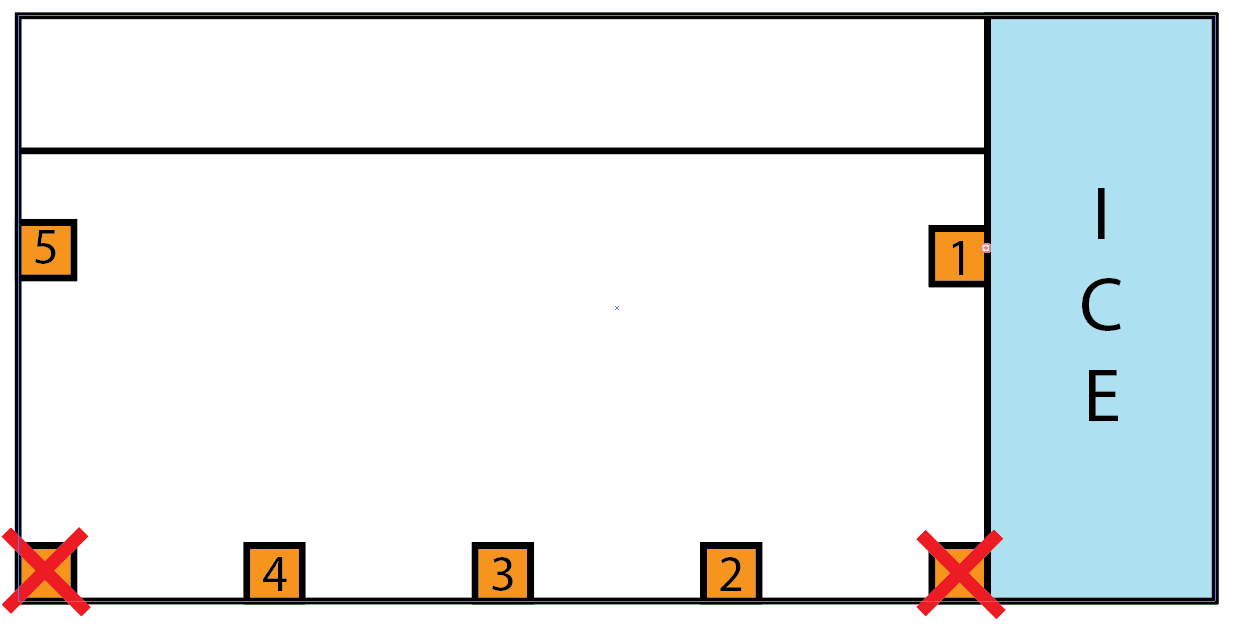
Similarly, to the first tank experiment, the particle tracker and thermometers were used to monitor the circulation and temperature in the tank. Below are plotted several particle tracks. The particles clearly do not follow the same regular, axi-symmetric motion as in the Hadley experiment.

For the temperature profiles of each sensor, we found a periodic trend of temperature, which corresponds to the observed circulation pattern: circulating from the inner part to the outer part and vice versa


To verify the assumption that Eddy circulation plays role in transferring heat, we expect the calculated heat flux from the melt ice to be in the same magnitude as the heat flux from Eddy circulation.
...